Data & Reports
Bachelor's Degree Recipients 2021-22
18,058 bachelor's degrees were conferred from 608 approved programs.
10,605 bachelor's degrees in chemistry
7,453 bachelor's degrees in biochemistry
2022 Bachelor's Degree Recipients
Gender Distribution

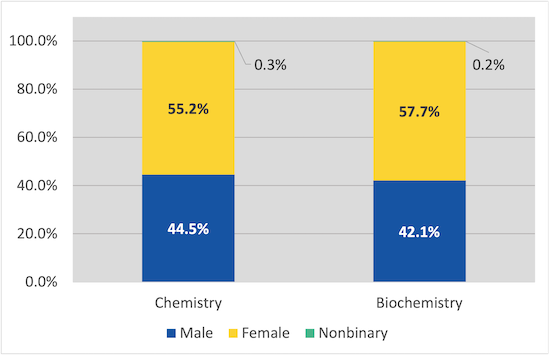
Gender distribution for chemistry and biochemistry bachelor's degree recipients for the 2021-22 academic year. The gender diversity in both majors skews slightly toward those identifying as female with 55.2% female, 44.5% male, and 0.3% non-binary in chemistry and 57.7% female, 42.1% male, and 0.2% non-binary in biochemistry. (N = 630)
Bachelor's Degree Recipients 2020-21
19,866 bachelor's degrees were conferred from 654 approved programs.
12,071 bachelor's degrees in chemistry
7,795 bachelor's degrees in biochemistry
2021 Bachelor's Degree Recipients
Gender Distribution

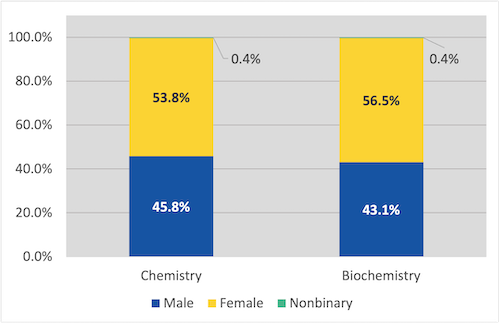
Gender distribution for chemistry and biochemistry bachelor's degree recipients for the 2020-21 academic year. The gender diversity in both majors skews slightly toward those identifying as female with 53.8% female, 45.8% male, and 0.4% non-binary in chemistry and 56.5% female, 43.1% male, and 0.4% non-binary in biochemistry. (N = 656)
Bachelor's Degree Recipients from ACS Approved Institutions
Gender - 2002-2022

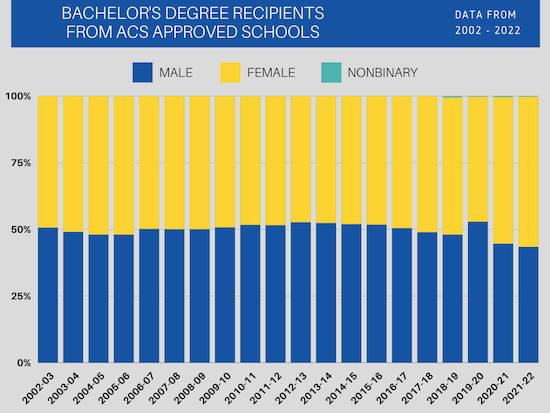
Gender distribution for bachelor's degree recipients from 2002-2003 to 2021-2022 academic years. Data were gathered from annual reports and are from ACS approved institutions only (n ranges from 600 to 700 approved programs per year). The gender diversity for bachelor's degree recipients averages to 50.5% male and 49.4% female (note that non-binary data has only been collected since 2019-2020 and is not included in these averages). There has been little variance away from these averages over the past 20 years. However, we are seeing a slight increase in the number of females receiving bachelor's degrees over the last 8 years (with 2019-2020 as an outlier).
Bachelor's Degree Recipients Demographics 2021-2022
| n = 631 | Chemistry | Biochemistry | Total |
| Asian American | 17.1% | 19.7% | 18.2% |
| Black, African-American | 9.3% | 6.3% | 8.1% |
| Hawaiian, Pacific Islander | 0.1% | 0.3% | 0.2% |
| Latinx, Hispanic | 13.6% | 12.6% | 13.2% |
| Native American, Alaskan | 0.4% | 0.4% | 0.4% |
| White, non-Hispanic | 53.2% | 49.3% | 51.6% |
| More than 2 | 2.7% | 4.0% | 3.3% |
| Unknown | 3.6% | 7.4% | 5.2% |
Demographic data for domestic students that received a bachelor's degree from one of the 631 ACS approved programs that submitted 2022 annual reports.
There were no significant shifts in any category compared to the data from 2020-21.

