pH and Color Change
Lesson Summary Video for teachers
Note: This video is designed to help the teacher better understand the lesson and is NOT intended to be shown to students. It includes observations and conclusions that students are meant to make on their own.
Key Concepts
- Whether a solution is acidic or basic can be measured on the pH scale.
- When universal indicator is added to a solution, the color change can indicate the approximate pH of the solution.
- Acids cause universal indicator solution to change from green toward red.
- Bases cause universal indicator to change from green toward purple.
- Water molecules (H2O) can interact with one another to form H3O+ ions and OH− ions.
- At a pH of 7, there are equal numbers of H3O+ ions and OH− ions in water, and this is called a neutral solution.
- Acidic solutions have a pH below 7 on the pH scale.
- Basic solutions have a pH above 7 on the pH scale.
Summary
Students will see a demonstration of a color change using universal pH indicator. Students will change the concentrations of an acid and a base and use universal indicator to test the pH of the resulting solutions. Students will see an animation showing that water molecules interact and separate into the H3O+ ion and the OH− ion. Students will see that the pH of a solution is related to the concentration of these ions in water.
Objective
Students will be able to explain, on the molecular level, that pH is a measure of the concentration of the H3O+ ions in water and that adding an acid or a base to water affects the concentration of these ions.
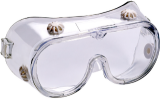
Safety
Be sure you and the students wear properly fitting goggles during the activity and wash hands afterwards. Sodium carbonate may irritate skin. Citric acid is an eye irritant. Universal indicator is alcohol-based and flammable. Read and follow all safety warnings on the label. At the end of the lesson, have students pour their used solutions in a waste container. Dispose of this waste down the drain or according to local regulations. The leftover citric acid and sodium carbonate powders can be disposed of with the classroom trash.
Materials for the Demonstration
- 3 clear plastic cups
- Citric acid
- Sodium carbonate
- Universal indicator solution
- Water
Materials for Each Group
- 3 clear plastic cups
- Masking tape and pen or permanent marker
- Universal indicator solution
- pH color chart
- Water
- Citric acid
- Sodium carbonate
- Graduated cylinder
- At least 12 flat toothpicks
- 2 6-well spot plates or 1 12-well spot plate
- 3 droppers
About the Materials
For this lesson, each group will need a Universal Indicator pH Color Chart. Print enough pages of these charts on a color printer so that each group can have its own chart.
- Universal Indicator pH Color Chart PDF
Each group will also need Universal Indicator Solution, citric acid (anhydrous), and sodium carbonate (anhydrous – Laboratory grade). Each group will need either two 6-well spot plates or one 12-well spot plate.
- Universal Indicator Solution: Flinn Product #U0002
- Citric acid (anhydrous): Flinn Product #C0136 (500 grams)
- Sodium carbonate (anhydrous, laboratory grade): Flinn Product #S0052.
- 6-well spot plates: NASCO Product #SB40727M
- 12-well spot plate: Flinn Scientific, Flinn Product #AP6399.
About this Lesson
Because of their chemical properties, reactions involving acids and bases are different from the chemical reactions students have seen so far in Chapter 6. In the previous lessons, it was always the electrons that were being shared or transferred when atoms interacted. In the next three lessons about acids and bases, things are a little different. With acids and bases, it is a proton from a hydrogen atom that is transferred from one substance to another.
The main aspect of acids and bases that students will explore in the next three lessons deals with the influence of acids and bases on water. The reactions of acids and bases with water are measured using the pH scale. Understanding pH on the molecular level will give students a better appreciation for some of the environmental issues involving acids and bases. The meaning of pH and the way it is affected by acids and bases can be a little tricky, but by using animations, drawings, and some simplifications, students should be able to understand the main ideas.
Download All Lesson 6.8 Resources
Get the entire lesson plan and Student Activity Sheet for "Lesson 6.8 - pH and Color Change."
Online Assignments
Supplement in-class learning with interactive, multimedia-rich Google Forms lesson modules, perfect for reinforcing key chemistry concepts and scientific investigation skills.
Instructions
1 Engage
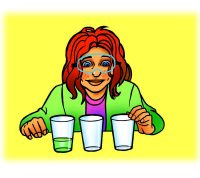
Step 1
Add universal indicator solution to an acid and a base hidden in “empty” cups to demonstrate how an acid and a base can change the color of a pH indicator.
Materials for the Demonstration
- 3 clear plastic cups
- Citric acid
- Sodium carbonate
- Universal indicator solution
- Water
Note: Your local tap water is likely fine for the demonstration and activities in this lesson. If the indicator solution you make is not green, this means that your water is either acidic or basic. If this happens, use distilled water, which is available in supermarkets and pharmacies.
Teacher Preparation
Make indicator solution for student groups
- Make a dilute universal indicator solution for this demonstration and for each student group by combining 250 mL water with 10 mL universal indicator solution.
- Pour about 25 mL of this dilute universal indicator solution into a clean cup for each student group.
Note: In the activity, students will fill 12 wells with universal indicator solution. Check to make sure that 25 mL of solution is enough. You will need about 50 mL of indicator solution for your demonstration. If 250 mL of solution is not enough, make more using the same proportions.
Prepare for the Demonstration
- Pour about 50 mL indicator solution into a clear plastic cup for you to use in the demonstration.
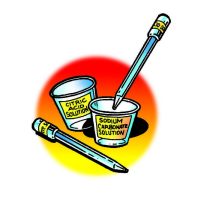
- Using two empty clear plastic cups, add about ⅛ teaspoon of citric acid to one cup and ⅛ teaspoon of sodium carbonate to the other. Do not tell students that you have added anything to the cups.
Procedure
- Pour about ⅓ of the indicator solution into the citric acid cup and ⅓ into the sodium carbonate cup. Leave ⅓ in the indicator cup.
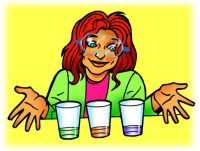
Expected Results
The citric acid turns the indicator from green to reddish. The sodium carbonate turns the indicator from green to purple.
Reveal to students that you put something in the cups beforehand.
Ask students:
- Do you think this was a chemical reaction? Why or why not?
A color change is often a clue that a chemical reaction has taken place. So, the color change in each cup is likely the result of a chemical reaction. (This point is made in Chapter 6, Lesson 6.)
- Would you say that the substances that were in the cups before the liquid was added were the same or different? Why?
The liquid in each cup turned a different color during the reaction. Because substances react chemically in characteristic ways and the substances reacted differently, the substances in each cup must be different.
Tell students that the green solution was made by adding a substance called universal indicator to water. Explain that you put a small amount of a substance, one an acid and one a base, in each cup. Don’t tell students which cup contained the acid or base.
Tell students that when you poured universal indicator solution into the cups, the acid and base each reacted with the indicator and changed its color. Usually, when two substances are mixed and a color change results, that is a clue that a chemical reaction has taken place. The cause of this color change will be discussed later in this lesson when students do their own activity.
Tell students that they will use an acid, a base, and universal indicator solution to learn about how acids and bases affect water. They will also learn how to measure the effect with colors and numbers on the pH scale.
Step 2
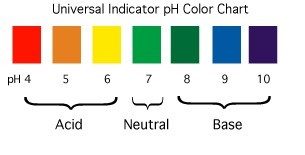
Have students compare the color of the solutions made in the demonstration to the colors on the Universal Indicator pH Color Chart.
Distribute one Universal Indicator pH Color Chart to each group. The charts can be found right before the student activity sheets. Explain that the chart shows the range of color changes for universal indicator when acidic or basic solutions are added to the indicator.
Point out that each color has a number associated with it and that students will learn more about these numbers later in the lesson. As the solution becomes more acidic, the color changes from green toward red. As the solution becomes more basic, the color changes from green toward purple.
Hold up the cups from the demonstration and ask the following questions:
- What does the color of the liquid in each cup tell you about the substance that was already in the cup when the indicator was added?
The cup that turned reddish initially contained an acid, and the cup that turned purple initially contained a base.
- What does the green color of the indicator tell you about the water in that cup? Is it acidic, basic, or neither?
The green indicator left in the cup is neither acidic nor basic, so it must be neutral.
Step 3
Introduce the acid and base used in the demonstration and discuss how the color of universal indicator may change with other common acids and bases.
Explain that before class, you placed a small amount of citric acid in the cup that turned red and a small amount of sodium carbonate in the cup that turned purple. So citric acid is an acid and sodium carbonate is a base.
Acids and Universal Indicator Solution
Explain that citric acid is in citrus fruits such as lemons, limes, and oranges.
Ask students:
- What are some other common examples of acids?
Students might say that vinegar is an acid. You could point out that there are also stronger acids, like sulfuric acid used in car batteries.
- What colors would you expect to see if you placed any of these substances in universal indicator?
The color may change to yellow, orange, or red for these acids.
Bases and Universal Indicator Solution
Explain that sodium carbonate is one of the chemicals commonly used in detergents made for dishwashing machines.
Ask students:
- What are some other common examples of bases?
Students may not know any examples of bases, but you can tell them that soaps, ammonia, and other cleaners are often bases.
- What colors would you expect to see if you placed any of these substances in universal indicator?
The color may change to dark green, blue, and purple for any of these bases. (For universal indicator, the changes in color for bases are not as different as they are for acids.)
Tell students that next they will explore the color changes of universal indicator with small amounts of citric acid and sodium carbonate.
2 Evaluate
Give each student an activity sheet.
- Lesson 6.8 Student Activity Sheet PDF | DOCX | Google Doc
- Lesson 6.8 Activity Sheet Answers PDF | DOCX | Google Doc
Download the student activity sheet, and distribute one per student.
The activity sheet will serve as the “Evaluate” component of each 5-E lesson plan. The activity sheets are formative assessments of student progress and understanding. A more formal summative assessment is included at the end of each chapter.
Students will record their observations and answer questions about the activity on the activity sheet. The Explain It with Atoms & Molecules and Take It Further sections of the activity sheet will either be completed as a class, in groups, or individually depending on your instructions. Look at the teacher version of the activity sheet to find the questions and answers.
3 Explore
Step 4
Have students prepare the solutions for the activity.
Explain to students that they will first make their solutions for the activity. Either go through each step with them or have them follow the procedure described on their activity sheet.
Teacher Preparation
Students will need small amounts of sodium carbonate and citric acid for the activity.
- Label two small plastic cups citric acid and sodium carbonate for each group.
- Place about ¼ teaspoon of citric acid and sodium carbonate in the labeled cups.
- Distribute the cups with universal indicator solution to each student group.
Materials for Each Group
- 2 clear plastic cups
- 3 droppers
- Masking tape and pen or permanent marker
- Universal indicator in cup
- Water
- Graduated cylinder
- Sodium carbonate
- Citric acid
- 2 flat toothpicks
Label your equipment
- Use masking tape and a pen to label one cup citric acid solution and another cup sodium carbonate solution.
- Use a small piece of masking tape and a pen to label one dropper citric acid solution and the other dropper sodium carbonate solution.

- Use your graduated cylinder to add 5 mL of water to the cup labeled citric acid.
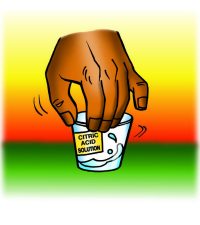
- Use a flat toothpick to pick up as much citric acid as you can on the end of the toothpick as shown.
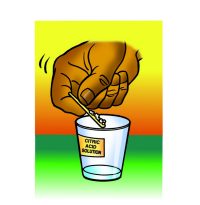
- Add this citric acid to the water in the citric acid cup. Gently swirl until the citric acid dissolves.
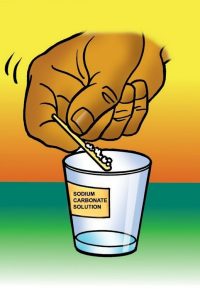
- Use your graduated cylinder to add 5 mL of water to the cup labeled sodium carbonate.
- Use a flat toothpick to pick up as much sodium carbonate as you can on the end of a toothpick.
- Add this sodium carbonate to the water in the sodium carbonate cup. Gently swirl until the sodium carbonate dissolves.
Step 5
Explain what students will do in the next activity and discuss the purpose of having a control.
Explain to students that in this activity they will fill the wells in each spot plate with universal indicator solution. Then in the first spot plate, they will test how different concentrations of citric acid affect the color of universal indicator solution. In the other spot plate, they will test how different concentrations of sodium carbonate affect the color of universal indicator solution.
Tell students that in each spot plate, they will add nothing to the indicator solution in the first well. This is because the first well will serve as the control.
Ask students:
- Why is it important to have a control?
The control is left alone and not changed so that any color changes in the other wells can be compared to the original color in the control.
Step 6
Have students test increasing concentrations of citric acid solution.
Question to Investigate
How does the concentration of citric acid affect the color of universal indicator solution?
Materials for Each Group
- Universal indicator solution
- pH color chart
- Citric acid solution
- At least 6 toothpicks
- Spot plate
- 2 droppers
Procedure
Test your citric acid solution
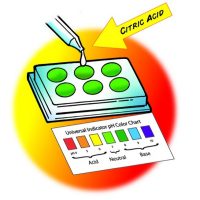
- Use one of your droppers to nearly fill 6 wells in your first spot plate with the universal indicator solution. Place the Universal Indicator pH Color Chart in front of the spot plate.
- Use your dropper to add 1 drop of citric acid solution to the second well. Gently mix the liquid with a clean toothpick.
- Compare the color of the liquid to the control and to the Universal Indicator pH Color Chart. Record the color of the indicator, the number of toothpicks of citric acid, and the pH number in the chart on the activity sheet for well 2.
Expected Results
The color of the indicator should turn yellow-green or yellow. If there is no obvious color change after adding a toothpick of citric acid, have students add a little more citric acid to the solution. Tell them to be sure to pick up as much citric acid as they can on the end of a toothpick.
Record Observations
Help students fill out the chart on their activity sheet. Students may say that the color of the solution in well 2 is yellow or yellow-green. Then have students assign a number for pH. Tell students that if the color in the well seems to be between two colors on the chart, they should assign a pH value between the two.
Tell students that in the next part of the activity they will add a little more citric acid to the citric acid solution. This will make the citric acid solution more concentrated. Just as they did before, they will add one drop of citric acid solution, but this time the citric acid solution will be more concentrated.
Ask students to make a prediction:
- How do you think the color will change if you add one drop of a more concentrated citric acid solution to the universal indicator in the next well?
Procedure
Test a more concentrated citric acid solution
- Add another toothpick scoop of citric acid to the citric acid cup. Gently swirl until the citric acid dissolves.
- Add 1 drop of this more concentrated citric acid solution to the third well. Gently mix the solution with a clean toothpick.
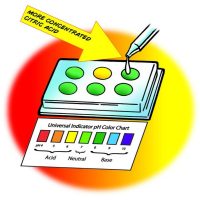
- Compare the color of the solution to the control and to the Universal Indicator pH Color Chart. Record the color of the indicator, the number of toothpick scoops of citric acid added, and the pH number in the chart for well 3.
- Continue adding toothpicks of citric acid and testing the solution in the last three wells to see how many different colors you can get.
Expected Results
As the citric acid solution becomes more concentrated, the color should change to variations of yellow-green, yellow, yellow-orange, orange, orange-red, and red. The colors obtained will vary from group to group because of the different amounts of citric acid students can pick up on the end of a toothpick. Students may be able to get 4 or 5 different colors. The answers and colors included in the chart below will vary.
The color and pH of different concentrations of citric acid | |||
| Well number | Number of toothpicks of citric acid used in 5 mL of water | Color | pH |
1 | 0 | Green | 7 |
2 | 1 | Yellow-green | 6.5 |
3 | 2 | Yellow | 6 |
4 | 3 | Light orange | 5.5 |
5 | 4 | Peach | 5 |
6 | 5 | Pink | 4 |
Ask students:
- How does the color of the indicator solution change as the citric acid solution becomes more concentrated?
As the citric acid solution becomes more concentrated, the color moves from green toward red on the pH color chart. - How does the number on the pH scale change as the concentration of citric acid solution increases?
As the citric acid solution becomes more concentrated (more acidic), the number on the pH scale decreases.
Step 7
Have students test increasing concentrations of sodium carbonate solution.
Note: The differences in color on the base side of the pH scale for universal indicator are not as obvious as those on the acid side. Students will have to look harder to see the difference between green-blue, blue, blue-purple, and purple.
Question to Investigate
How does the concentration of sodium carbonate affect the color of universal indicator solution?
Materials for Each Group
- Universal indicator solution
- pH color chart
- Sodium carbonate solution
- At least 6 toothpicks
- Spot plate
- 2 droppers
Procedure
Test your sodium carbonate solution
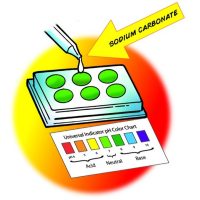
- Use a dropper to nearly fill the 6 wells in your other spot plate with universal indicator solution. You will not add anything else to the first well.
- Add 1 drop of sodium carbonate solution to the second well. Gently mix the solution with a clean toothpick.
- Compare the color of the solution to the control and to the Universal Indicator pH Color Chart. Record the color of the indicator, the number of toothpicks of sodium carbonate used to make the solution, and the pH number in the chart for well 2.
Expected Results
The color of the indicator should turn green-blue or blue.
Ask students to make a prediction:
- How do you think the color will change if you add one drop of a more concentrated sodium carbonate solution to the universal indicator in the next well?
Tell students that if you add more base to the same amount of water, the concentration of the base increases.
Procedure
Test a more concentrated sodium carbonate solution
- Add another toothpick of sodium carbonate to the sodium carbonate cup. Gently swirl until the sodium carbonate dissolves.
- Add 1 drop of sodium carbonate solution to the next well. Gently mix the liquid with a clean toothpick.
- Compare the color of the liquid to the control and to the Universal Indicator pH Color Chart. Record the color of the indicator, the number of toothpicks of sodium carbonate used, and the pH number in the chart for well 3.
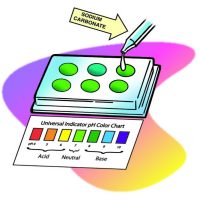
- Continue adding toothpicks of sodium carbonate and testing the solution in the last three wells to see how many different colors or shades you can make.
Expected Results
The more concentrated sodium carbonate solution should cause the color to change to a darker blue moving toward purple. Answers and colors in the chart below will vary.
The color and pH of different concentrations of sodium carbonate | |||
Well number
| Number of toothpicks of sodium carbonate used in 5 mL of water | Color
| pH
|
1 | 0 | Green | 7 |
2 | 1 | Green-blue | 8 |
3 | 2 | Blue | 8.5 |
4 | 3 | Blue-purple | 9 |
5 | 4 | Purple | 9.5 |
6 | 5 | Purple | 10 |
Ask students:
- How does the color of the indicator solution change as the sodium carbonate solution becomes more concentrated?
As the sodium carbonate solution becomes more concentrated, the color moves from green toward purple on the pH color chart. - How does the number on the pH scale change as the concentration of base increases?
As the sodium carbonate solution becomes more concentrated (more basic), the number on the pH scale increases.
4 Explain
Step 8
Explain how water molecules interact with each other to form ions.
Tell students that pH has to do with the way acids and bases interact with water. Explain that first you will show students how water molecules interact with each other before an acid, or a base is added.
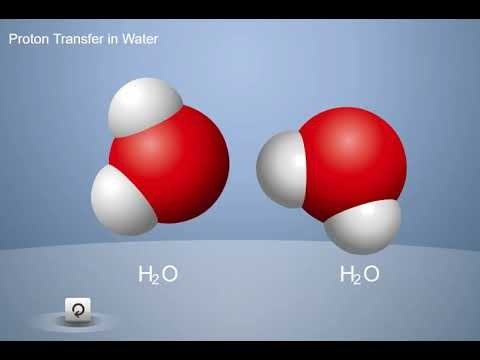
Project the animation Proton Transfer in Water

Play the first part of the animation.
Remind students that each hydrogen atom in a water molecule has both a proton and an electron. The hydrogen atoms share their electrons with the oxygen atom.
Click “next” to show how the water molecules become ions.
Water molecules continuously move and bump into one another. Sometimes when two water molecules come together, a proton from one hydrogen atom leaves its water molecule and becomes part of another water molecule. Only the positively charged pro-ton moves; the negatively charged electron stays behind. So, these two H2O molecules become the ions H3O+ and OH−.
Click “next” again to show how the ions become water molecules again
Explain that when these ions bump into each other, the proton from the H3O+ can move over to the OH− ion, forming two regular water molecules again. Because protons go back and forth between the water molecules or between ions continuously, there is always the same amount of H3O+ and OH− ions in water.
Project the illustration Water Molecules Trade Protons.
This illustration shows the chemical equations that explain how water molecules can become ions and how ions can become water molecules again.
Explain to students that the first chemical equation shows two water molecules coming together. Point out the chemical formula for each water molecule, H2O.
- Explain the formation of the H3O+ ion.
After the proton is transferred, the water molecule that now has the extra proton is called an H3O+ ion. The reason why the number of hydrogen atoms changed from two (the subscript in H2) to three (the subscript in H3) is because having an extra proton is like having an extra hydrogen atom, even though the electron did not come over with it. Because one proton was added, there is one more proton than electrons, making this a positive ion.
- Explain the formation of the OH− ion.
The water molecule that lost a proton now has an extra electron, so it is called the OH− ion. The reason why the number of hydrogen atoms changed from two (the subscript in H2) to one (no subscript after the H means 1 hydrogen) is because losing a proton is like losing a hydrogen atom. Because only the proton was transferred, there is one more electron than proton, making this a negative ion.
Tell students that the second chemical equation shows an H3O+ ion and OH− ion coming together to become water molecules again.
- Explain the reformation of two H2O molecules.
Explain to students that water molecules and ions are always colliding. When an H3O+ ion and an OH− ion bump into each other, the proton can be transferred from the H3O+ ion over to the OH− ion so that each ion becomes an H2O molecule again.
At any given time in an ordinary sample of water, a small percentage of water molecules are transferring protons and becoming ions. Also, the H3O+ and OH− ions are transferring protons and becoming water molecules again.
Step 9
Explain how acids and bases cause the indicator to change color.
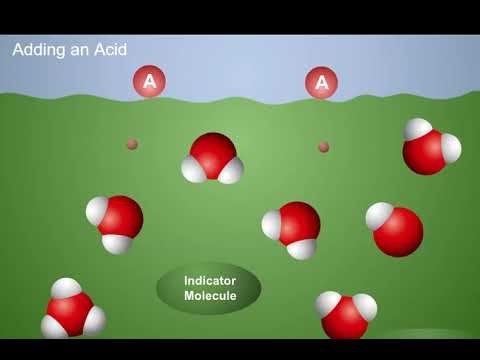
Project the animation Acids Donate Protons.

Tell students that when an acid is added to an indicator solution, the acid donates protons to the water molecules. This increases the concentration of H3O+ ions in the solution. The H3O+ ions donate protons to the indicator molecules causing the indicator to change color toward red.
Project the animation Bases Accept Protons.
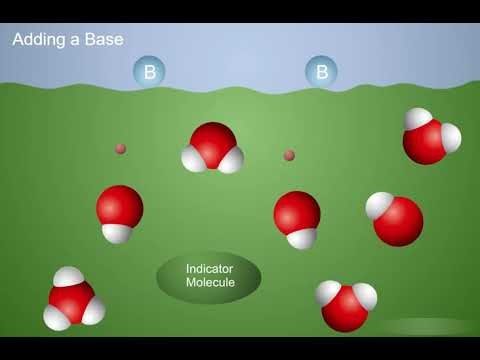
When a base is added to an indicator solution, it accepts protons from the water molecules, creating OH− ions. The H3O+ ions and indicator molecules donate protons to the OH− ions, causing the indicator to change color toward purple.
Read more about strength vs. concentration in acids and bases in Teacher Background.
- Lesson 6.8 Teacher Background PDF
5 Extend
Step 10
Have students slowly pour their remaining acidic and basic solutions into the indicator solution to introduce the idea that acids and bases can neutralize each other.
Ask students to make a prediction:
- How do you think the color will change if you pour a small amount of each left-over solution into your universal indicator solution?
Materials for Each Group
- Universal indicator solution
- pH color chart
- Citric acid solution
- Sodium carbonate solution
Procedure
- Pour a small amount of either your citric acid solution or sodium carbonate solution into your indicator solution. Swirl and compare the color to your Universal Indicator pH Color Chart.
- Pour a small amount of the other solution into your indicator solution. Swirl and compare the color to your color chart.
- Continue pouring small amounts of the acid and base solutions into your indicator until the solutions are used up.
Expected Results
The colors of the indicator solution will vary, but students should see that acids and bases mixed together cause the color of the indicator to change toward neutral.
Have students describe what they did and their observations. Then explain that in Chapter 6, Lesson 9, they will combine acids and bases in an indicator solution with the goal of making the pH of the final solution neutral.
What is the 5-E format?
The 5-E instructional model is an approach to teaching and learning that focuses on active engagement, inquiry-based learning, and collaboration.

Downloads
For Students
- Lesson 6.8 Student Activity Sheet PDF | DOCX | Google Doc
- Universal Indicator pH Color Chart PDF
For Teachers
- Lesson 6.8 Lesson Plan PDF | DOCX | Google Doc
- Lesson 6.8 Activity Sheet Answers PDF | DOCX | Google Doc
- Lesson 6.8 Teacher Background PDF
Resources for the entire Chapter 6
- Chapter 6 Student Reading PDF | DOCX | Google Doc
- Chapter 6 Test Bank PDF | DOCX | Google Doc
Interactive Lesson Modules
- Lesson 6.8 Online Assignments Google Form
Have Questions? Visit Help Center
;void(0);)